
UGC -NET JRF SET | Paper 1 | Research Aptitude | Complete Syllabus | One Shot Revision | Kanchan Solani
Research Aptitude | Complete Syllabus | One shot revision |
Definition :- Research is defined as the creation of new knowledge and the use of existing knowledge in a new and creative way.
- Research refers to a series of systematic activity or activities undertaken to find out the solution of a problem.
- It is a systematic, logical and an unbiased process wherein verification of hypothesis, data analysis, interpretation and information of principles can be done.
- It is an intellectual enquiry or quest towards truth.
- It leads to enhancement of knowledge.


- The Research should be Systematic
- The Research should be Objective
- The Research should be Logical
- The Research should be Reductive
- The Research should be Replicable
- The Research should be Generalized Outcomes
- Deductive - Reasoning from general principles to specific cases.
- Quantitative - Involving the measurement of quantity or amount.
- Certainly - Without doubt; definitely.
- Objective- Not influenced by personal feelings or opinions.
- Scientific -Based on or characterized by the methods and principles of science.
- Deterministic -Belief that all events are determined by previously existing causes.
- Absolute Reality -The state of things as they actually exist, independent of perception.
- Probability Sample-A sample that gives each member of the population an equal chance of being selected.
- Structured and Controlled- Organized in a systematic way, with strict regulation.
According to the , post-positivism includes an emphasis on critical realism, which holds that while an objective reality exists, it can only be imperfectly understood. Researchers must remain critical of their own findings and open to alternative interpretations.
- Inductive: Reasoning from specific observations to general conclusions.
- Qualitative: Involving non-numerical data and understanding meanings or experiences.
- Probability: The likelihood or chance of an event occurring.
- Subjectivity: Influenced by personal feelings, opinions, and perspectives.
- Humanistic: Focusing on human values, experiences, and individuality.
- Non-Deterministic: Not pre-determined; outcomes can vary and are influenced by multiple factors.
- Critical Reality: Acknowledging that while reality exists, our understanding of it is influenced by context and perspective.
- Non-Probability Sample: A sample where not every member of the population has an equal chance of being selected.
- Unstructured and Uncontrolled: Lacking a systematic or regulated approach.
Philosophical Concepts :-
- Ontology :- What is the nature of reality ?
- Epistemology :- What can be accepted as knowledge ?
- methodology :- How knowledge regarding given question can be produce?
- Methods :- What specific ways of data collection and data analysis can be used?
- paradigms :- What are the conceptual and/or methodological models that relate to a specific discipline during a particular period of time
- Pragmatism-External, Multiple , View Chosen to best enable answering of research question
- Realism-Objective, Exist independently of human thoughts and belief or knowledge of their existence (realist) but is interpreted through social conditioning (critical realist)
- Interpretivism-Socially Constructed, Subjective, May Change, Multiple
- Metaphysics - Beyond Physics
HYPOTHESIS
A hypothesis is a testable and falsifiable statement or prediction about the relationship between two or more variables. It is formulated based on theoretical frameworks, empirical evidence, and prior research. Hypotheses serve as the foundation for scientific investigations and experimental designs, guiding the methodology and the collection of data to either support or refute the proposed explanation.
In the context of UGC NET examination, key terms associated with hypotheses include:
- Independent Variable: The variable that is manipulated or controlled in an experiment.
- Dependent Variable: The variable that is measured and observed to assess the effect of the independent variable.
- Null Hypothesis (H0): A statement asserting that there is no effect or no relationship between variables.
- Alternative Hypothesis (H1): A statement asserting that there is an effect or a relationship between variables.
- Operational Definition: The precise definition of variables in terms of measurable factors.
- Statistical Significance: The probability that the observed effect is not due to chance.
- Control Group: A group that does not receive the experimental treatment and is used for comparison.
- Experimental Group: A group that receives the experimental treatment.
- Random Sampling: The process of selecting a sample from a population in such a way that each member has an equal chance of being selected.
- Replication: The process of repeating an experiment to verify results.
- Empirical Reference: A hypothesis should explain or support all the sufficient facts needed to understand what the problem is all about.
Hypothesis Testing
Key Concepts in Hypothesis Testing:
Null Hypothesis (H0): The default assumption that there is no effect or no difference. It is the hypothesis that researchers aim to test against.
- Example: H0: μ1 = μ2 (The means of two populations are equal).
Alternative Hypothesis (H1 or Ha): The hypothesis that there is an effect or a difference. It contradicts the null hypothesis.
- Example: H1: μ1 ≠ μ2 (The means of two populations are not equal).
Significance Level (α): The threshold for determining whether the observed data is statistically significant. Commonly used values are 0.05, 0.01, and 0.10.
p-Value: The probability of obtaining test results at least as extreme as the observed results, assuming that the null hypothesis is true. If the p-value is less than the significance level, the null hypothesis is rejected.
Test Statistic: A standardized value calculated from sample data used to decide whether to reject the null hypothesis. Examples include t-statistic, z-statistic, chi-square statistic, etc.
Critical Value: The threshold value that separates the region where the null hypothesis is rejected from the region where it is not rejected. It is determined based on the significance level and the sampling distribution.
Type I Error (α Error): The error of rejecting the null hypothesis when it is true. This is also known as a false positive.
Type II Error (β Error): The error of failing to reject the null hypothesis when it is false. This is also known as a false negative.
Power of the Test: The probability of correctly rejecting the null hypothesis when it is false. It is calculated as 1 - β and indicates the test's sensitivity to detect an effect.
Confidence Interval: A range of values within which the true population parameter is expected to lie with a certain level of confidence (e.g., 95%).
Steps in Hypothesis Testing:
- State the Hypotheses: Formulate the null hypothesis (H0) and the alternative hypothesis (H1).
- Choose the Significance Level (α): Decide the threshold probability for rejecting the null hypothesis.
- Collect and Summarize Data: Gather sample data and calculate the test statistic.
- Determine the Critical Value or p-Value: Identify the threshold or calculate the p-value.
- Make a Decision: Compare the test statistic to the critical value or compare the p-value to α to decide whether to reject or fail to reject the null hypothesis.
- Interpret the Results: Draw conclusions based on the decision and the context of the study.
Parametric Tests or Standard Tests of Hypothesis
1. t-Test
The t-test is used to compare the means of two groups to see if they are significantly different from each other. There are different types of t-tests based on the nature of the data and the research question.
Independent t-Test:
- Purpose: To compare the means of two independent groups.
- Assumptions: Normal distribution, homogeneity of variances, and independent observations.
- Test Statistic: t = (X̄1 - X̄2) / SE, where SE is the standard error of the difference between means.
Paired t-Test:
- Purpose: To compare the means of two related groups.
- Assumptions: Normal distribution of the differences between paired observations.
- Example: Comparing the test scores of students before and after a specific intervention.
- Test Statistic: t = D̄ / (SD/√n), where D̄ is the mean difference, SD is the standard deviation of differences, and n is the number of pairs.
2. ANOVA (Analysis of Variance)
ANOVA is used to compare the means of three or more groups to see if at least one mean is different. It extends the t-test to more than two groups.
One-Way ANOVA:
- Purpose: To compare the means of groups based on one independent variable.
- Assumptions: Normality, homogeneity of variances, and independence of observations.
- Example: Comparing the test scores of students from three different teaching methods.
- Test Statistic: F = MSB / MSW, where MSB is the mean square between groups and MSW is the mean square within groups.
Two-Way ANOVA:
- Purpose: To examine the effect of two independent variables on a dependent variable and to study the interaction between them.
- Assumptions: Similar to one-way ANOVA.
- Example: Examining the effects of teaching method and gender on test scores.
- Test Statistic: F-values for each main effect and the interaction effect.
3. Chi-Square Test
The Chi-Square test is used to test the association between categorical variables.
Chi-Square Test of Independence:
- Purpose: To test whether two categorical variables are independent.
- Assumptions: Large expected frequencies.
- Example: Testing the independence between gender and voting preference.
- Test Statistic: χ² = Σ(O - E)² / E, where O is the observed frequency and E is the expected frequency.
Chi-Square Goodness of Fit Test:
- Purpose: To test whether the observed frequencies of a single categorical variable match the expected frequencies.
- Assumptions: Sufficiently large expected frequencies.
- Example: Testing if the distribution of dice rolls matches the expected uniform distribution.
- Test Statistic: Similar to the Test of Independence.
4. F-Test
The F-test is used to compare the variances of two populations. It is also a component of ANOVA.
- Purpose: To test if the variances of two populations are equal.
- Assumptions: Normality, homogeneity of variances, and independent observations.
- Example: Comparing the variability in test scores between two different classes.
- Test Statistic: F = s₁² / s₂², where s₁² and s₂² are the sample variances.
5. Regression Analysis
Regression analysis is used to examine the relationship between a dependent variable and one or more independent variables.
Simple Linear Regression:
- Purpose: To predict the value of a dependent variable based on one independent variable.
- Assumptions: Linearity, independence, homoscedasticity, and normality of residuals.
Example: Predicting a student's final exam score based on hours studied.
Test Statistic: R², F, t-values for coefficients.
Multiple Linear Regression:
- Purpose: To predict the value of a dependent variable based on multiple independent variables.
- Assumptions: Similar to simple linear regression.
- Example: Predicting a student's final exam score based on hours studied, attendance, and prior grades.
- Test Statistic: Similar to simple linear regression, with additional coefficients.
6. Z-Test
The Z-test is used to compare sample and population means or proportions, especially for large sample sizes (n > 30).
One-Sample Z-Test:
- Purpose: To test whether a sample mean is different from a known population mean.
- Assumptions: Normal distribution, known population variance, and large sample size.
- Example: Testing if the average height of a sample of adults differs from the national average.
- Test Statistic: z = (X̄ - μ) / (σ/√n), where X̄ is the sample mean, μ is the population mean, σ is the population standard deviation, and n is the sample size.
Two-Sample Z-Test:
- Purpose: To test whether the means of two samples are different.
- Assumptions: Similar to one-sample Z-test.
- Example: Comparing the average heights of men and women in a large sample.
- Test Statistic: z = (X̄₁ - X̄₂) / √(σ₁²/n₁ + σ₂²/n₂), where X̄₁ and X̄₂ are the sample means, σ₁² and σ₂² are the population variances, and n₁ and n₂ are the sample sizes.
Non-Parametric Tests or Standard Tests of Hypothesis
Sign Test:
- Purpose: To test the median of a single sample or the difference between paired samples.
- Assumptions: Ordinal data or continuous data that can be converted to ranks.
- Example: Testing whether a new teaching method significantly affects students' performance.
Fisher-Irwin Test:
- Purpose: To test the association between two categorical variables, especially useful for small sample sizes.
- Assumptions: Data are categorical and sample sizes are small.
- Technical Terms: Hypothesis, Categorical Data, Small Sample Sizes, Association.
McNemar Test:
- Purpose: To test for differences in proportions in paired nominal data.
- Assumptions: Paired or matched data, dichotomous outcomes.
- Example: Evaluating the effectiveness of a treatment by comparing pre-treatment and post-treatment outcomes for the same subjects.
- Technical Terms: Hypothesis, Proportions, Paired Nominal Data, Dichotomous Outcomes.
Wilcoxon Matched Pairs Test:
- Purpose: To compare two related samples or repeated measurements on a single sample to assess whether their population mean ranks differ.
- Assumptions: Paired or matched observations and ordinal data.
- Technical Terms: Hypothesis, Paired Samples, Mean Ranks, Ordinal Data.
Kolmogorov-Smirnov Test:
- Purpose: To compare a sample distribution with a reference distribution (one-sample) or to compare two sample distributions (two-sample).
- Assumptions: Continuous data.
- Example: Comparing the distribution of exam scores between two different classes.
- Technical Terms: Hypothesis, Distribution, Sample, Reference Distribution, Continuous Data.
Spearman's Rank Correlation:
Purpose: To measure the strength and direction of the association between two ranked variables.Assumptions: Ordinal data or continuous data that can be ranked.
- Example: Assessing the correlation between students' ranks in two different subjects.
- Technical Terms: Hypothesis, Correlation, Rank, Ordinal Data, Continuous Data.
Kruskal-Wallis H Test:
- Purpose: To compare the medians of three or more independent groups.
- Assumptions: Independent observations and ordinal data.
- Example: Comparing the test scores of students from three different teaching methods.
- Technical Terms: Hypothesis, Median, Ordinal Data, Independent Groups, Multiple Comparisons.
Friedman Test:
- Purpose: To compare the medians of three or more related groups.
- Assumptions: Paired or matched observations and ordinal data.
- Example: Comparing the performance of participants under three different conditions.
- Technical Terms: Hypothesis, Median, Paired Samples, Matched Pairs, Ordinal
Mann-Whitney U Test:
- Purpose: To compare the medians of two independent groups.
- Assumptions: Independent observations and ordinal data.
- Example: Comparing the satisfaction ratings of two different customer groups.
- Technical Terms: Hypothesis, Median, Ordinal Data, Independent Samples.
Sampling
Sampling is a methodological process in research where a subset of individuals or items (known as a sample) is selected from a larger group or population to represent that population. The primary objective of sampling is to make inferences about the population characteristics based on the analysis of the sample. By using appropriate sampling techniques, researchers can ensure that the sample accurately reflects the diversity and properties of the entire population, enabling reliable and valid conclusions.
Sampling is essential for efficient data collection, especially when dealing with large populations, limited resources, or time constraints. It plays a crucial role in ensuring the generalizability and accuracy of the research findings.
Probability Sampling
Simple Random Sampling:- Definition: Every member of the population has an equal chance of being selected. It is used for small homogeneous population.
- Example: Drawing names from a hat.
- Definition: Selecting every kth individual from a list of the population. It is also known as fixed interval method.
- Example: Choosing every 10th person on a list.
- Definition: Dividing the population into strata (subgroups) and randomly sampling from each stratum. It is used for Heterogeneous population. It is divided into a homogeneous group or strata and from each homogeneous group, a random sample is drawn. Stratified random sampling can be classified into the following:- (i)Proportionate stratified sampling (ii) Disproportionate stratified random sampling
- Example: Dividing a population by gender and selecting random samples from each group.
- Definition: Dividing the population into clusters, randomly selecting some clusters, and then sampling all members within those clusters. It is used in socio-economic surveys, public opinions polls, ecological studies, farm management services, rural credit services, demographic studies and large scale surveys of political and social behaviour, attitude surveys etc.
- Example: Dividing a city into districts and randomly selecting districts, then surveying everyone in the chosen districts.
- Definition: Combining several sampling methods, usually involving multiple stages of sampling.
- Example: Using cluster sampling to select districts, then using simple random sampling within selected districts.
Non-Probability Sampling
Convenience Sampling:Definition: Sampling individuals who are easiest to reach.
Example: Surveying people in a shopping mall.
Definition: Selecting individuals based on the researcher’s judgment about who will provide the best information.
Example: Choosing experts in a field for a study.
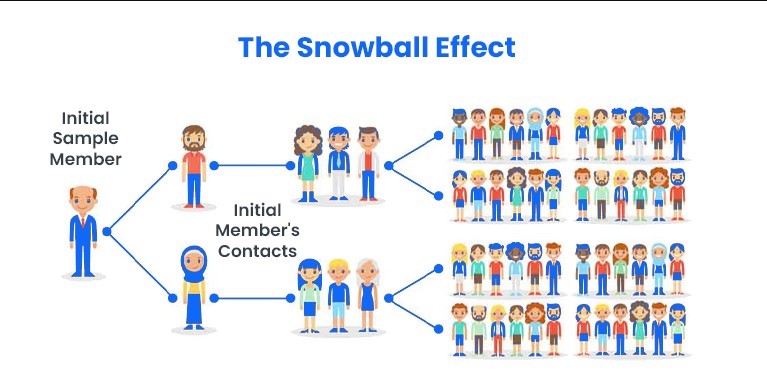
Definition: Participants recruit other participants from their acquaintance. Snow-ball sampling is a technique of building up a list or a sample of a special population by using an initial set of its members as informants
Example: Studying a hidden or hard-to-reach population like drug users.
Definition: Ensuring that the sample represents certain characteristics of the population.
Example: Interviewing a specific number of people from different age groups.
Technical Vocabulary and Keywords of Sampling :
- Population: The entire group of individuals or items that the researcher is interested in studying.
- Sample: A subset of the population selected for the study.
- Sampling Frame: A list or database from which the sample is drawn.
- Bias: Systematic error introduced by the sampling method that affects the validity of the results.
- Randomization: The process of making something random, in context, ensuring each member of the population has an equal chance of being selected.
- Strata: Subgroups within a population that share similar characteristics.
- Clusters: Groups within a population that can be sampled as a whole.
- Generalizability: The extent to which the results of a study can be applied to the broader population.
APA vs. MLA Writing Styles
Punctuations and Abbreviations in Footnotes
- ibid. (ibidem) - "In the same place."
- et al. (et alia) - "And others."
- op. cit. (opus citatum) - "The work cited."
- loc. cit. (loco citato) - "In the place cited."
- ca. (circa) - "Around" or "approximately."
- passim - "Throughout" or "here and there."
- q.v. (quod vide) - "Which see."
- viz. (videlicet) - "Namely" or "that is to say."
- cf. (confer) - "Compare."
- e.g. (exempli gratia) - "For example."
- i.e. (id est) - "That is."
- et seq. (et sequentes) - "And the following."
- N.B. (nota bene) - "Note well."
- ff. (folio) - "And the following pages."
- supra - "Above."
- infra - "Below."
- a.m. (ante meridiem) - "Before noon."
- p.m. (post meridiem) - "After noon."
- c. (circa) - "Approximately."
- cf. (confer) - "Compare."
- vs. (versus) - "Against."
- q.e.d. (quod erat demonstrandum) - "Which was to be demonstrated."
- sc. (scilicet) - "Namely."
- s.v. (sub verbo) - "Under the word."
- sic - "Thus" or "So" (used to indicate an exact quote with errors).
- id. (idem) - "The same (author)."
- ad loc. (ad locum) - "At the place."
- f. (folio) - "Page" (used to denote a specific page in a manuscript).
- ff. (folios) - "Following pages."
- l.c. (loco citato) - "In the place cited."
- ms. (manuscriptum) - "Manuscript."
- n.d. (no date) - "No date."
- n.p. (no place) - "No place (of publication)."
- p. (pagina) - "Page."
- pp. (paginae) - "Pages."
- repr. (reprint) - "Reprint."
- rev. (revised) - "Revised."
- trans. (translatio) - "Translation."
- vol. (volumen) - "Volume."
- ed. (editio) - "Edition."
- ed. (editor) - "Editor."
- eds. (editors) - "Editors."
- Anon. - "Anonymous"
- Ante.-"Before"
- Art.-"Article"
- Aug.-"Augmented"
- bull. - "Bulletin"
- ill. illus., or illust(s) - "illustrations"

No comments
If you want to ask any question regarding blog, please ask. I will be glad to answer that